
The Evolution of the Database behind NMR-Honey-ProfilingTM
In 2014 we launched NMR-Honey-Profiling at QSI. As it was a brand new approach for the Matrix honey and well established for analysis of juices at that time and also a rather complex one, our clients raised many questions on how it works and especially on the data the entire method is based on. This newsletter will address these questions.
From the technical point of view, NMR is widely accepted and also the employed statistical tools are considered standard tools. However, the quality of the database, i.e. authenticity of samples included, are always reason for questions.
Data quality is crucial
Quality of the data is crucial, as including adulterated samples in a database which is supposed to contain only authentic honeys, would render the entire approach simply useless. This is why QSI put an enormous effort in ensuring the authenticity of each and every sample that would be included in the database from the very beginning instead of just trusting spoken guarantees. For example, we used a very broad range of established analytical methods to make sure that no adulterated sample will end up in the database and distort statistics.
Mandatory and optional analyses
Though not particularly new, pollen analysis combined with sensory analysis is a great method to gain first information on a sample. A well trained examiner is able to detect defective tastes and odors which might be reflected in the NMR-profile. Furthermore, geographical as well as botanical origins are determined by the presence and amount of certain types of pollen. But this is just the beginning. We used many methods to verify authenticity (see also figure 1):
Mandatory analyses:
- Pollen analysis/sensory analysis/electrical conductivity
- General quality parameters (water content, HMF, diastase, pH, acidity)
- EA-IRMS (AOAC 998.12) to detect C4-sugar additions e.g. from cane and corn syrup
- HPLC-sugar spectrum (widely used and accepted standard method)
Risk based analyses:
- Oligosaccharides
- Foreign enzymes (residues from production of starch-based syrups)
- b-fructofuranosidasefAmyP (foreign alpha amylase)
- Thermostable enzymes
- Specific marker for beet sugar (SM-B, C3-sugar)
- Specific marker for rice sugar (SM-R, C3-sugar)
- LC-IRMS to detect C3/C4-sugar additions
- NMR-profiling
“Targeted” and “non-targeted”
You may wonder why we added NMR-profiling to the list. The reason is that also the NMR data can detect additional adulteration that cannot be detected using conventional methods. Furthermore, NMR data is checked for consistency, for example does a new potentially authentic acacia honey show the same profile as the other already fully authenticated acacia honey samples or are there any differences? Unlike the other methods, NMR-profiling is a non-targeted method, which means that it measures everything that is detectable by this method, which is true for most of the substances that can be found in honey. The established conventional methods are targeted methods instead, so they are “blind” to anything outside their scope. The EA-IRMS-method(AOAC 998.12) targets carbon isotopes and very well detects the addition of cane or corn sugar while addition of rice sugar remains unrecognized, as that does not change the isotopic composition towards heavier isotopes.
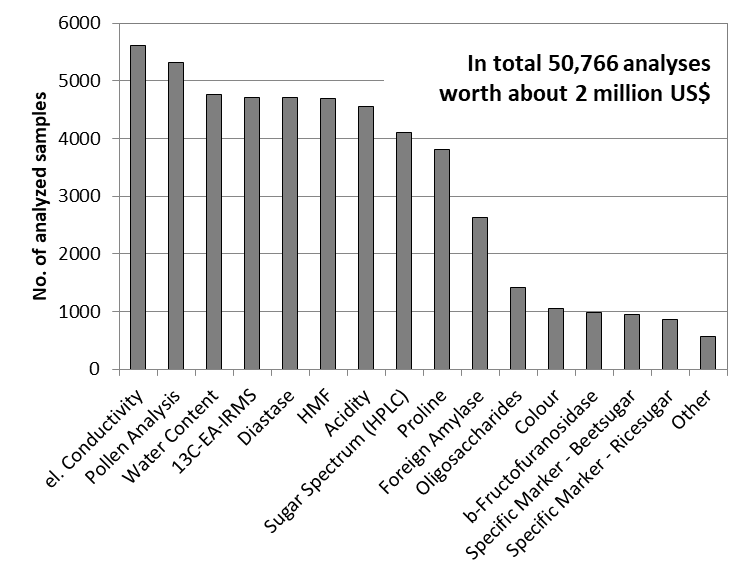
Figure 1: Number of analyses conducted in order to ensure authenticity of honey database samples.
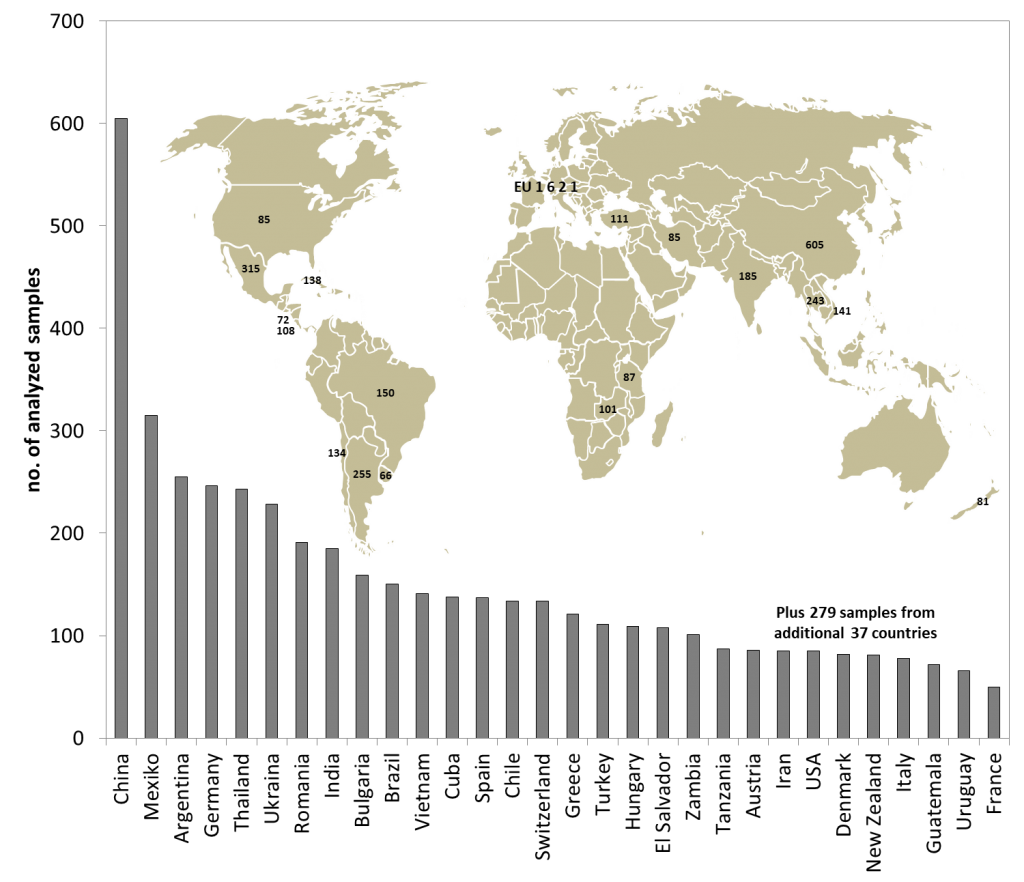
Figure 2: Samples per geographical origin analyzed for honey database.
How many samples are necessary?
Another question usually refers to the number of samples necessary for building a database. That depends of course on the variation of the sample set you are looking at. For example, if you take a subset of samples, say acacia honeys, the variations between the authentic honeys are far smaller than those compared to polyfloral honeys which vary stronger. So for acacia honey we need comparatively less samples to reach a certain statistical confidence level compared to polyfloral honeys with higher variations. As a rule of thumb, 100 samples per origin (botanical or geographical, depending on the aim) are a good start. With 200 you are already on a pretty safe side. However, if natural variations are very low, then even less than 100 samples can be enough. In figure 2 you can find an overview on the number of samples analyzed for the database per geographical origin and in figure 3 per botanical origin.
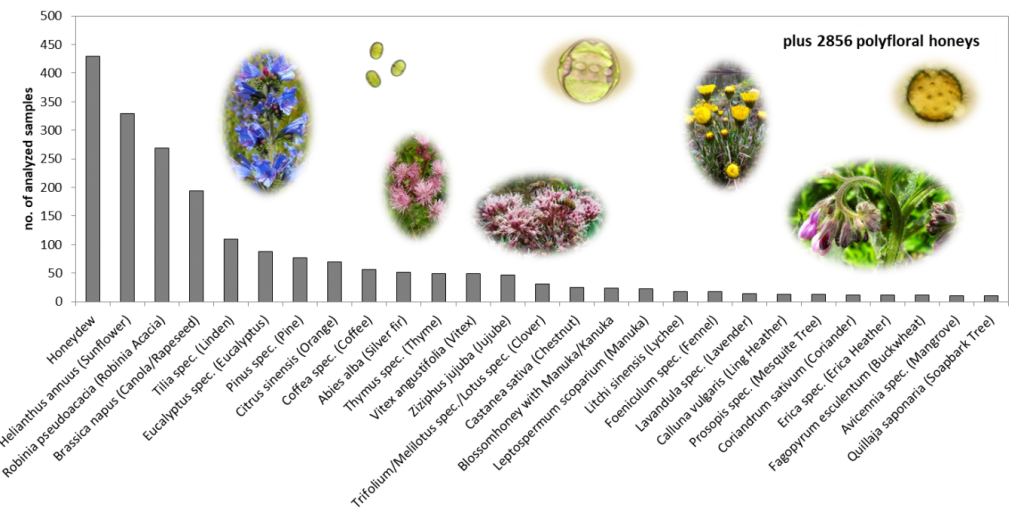
Figure 3: Samples per geographical origin analyzed for honey database.
Comparison of NMR with conventional analyses
Surely, nothing is 100% certain and just like any other method, NMR-profiling is not „perfect“. While addition of some syrups is easily detected, other syrups are not as easily recognized.
Our first and foremost aim is to prevent false positives, which will be well below 1% after the upcoming database update. Of those samples that were found adulterated by means of conventional analyses, NMR-profiling is able to confirm that in about 75% of all samples. However, the remaining 25% look typical to NMR. Further research has shown that most of those 25% NMR-typical (but adulterated according to conventional analyses) samples were found adulterated by testing for activity of foreign enzymes, which is a very sensitive method. NMR-profiling cannot determine the activity of those enzymes. Thus, well cleaned syrups would not cause suspicious peaks in the NMR-profile although they show foreign enzyme activity using a specific method for its detection.
Dilution effect
Still, even in these cases it might be possible to detect adulteration by observing a dilution effect (glucose and fructose peaks stay high why the remaining spectrum gets lower) which also points to adulteration. All in all it looks like the different results can be attributed to different limits of detections for certain types of adulteration. Furthermore, it has to be kept in mind, that excessive feeding of bees during honey flow can also cause positive findings for adulteration independent of the method used.
On the other hand we also found out that 14% of those samples that passed all conventional testing showed clear signs of adulteration in the NMR-profile.
In Brief
- NMR-profiling is able to detect adulterations which are not detectable with the current set of conventional method as syrups have been adapted to pass those methods undetected.
- NMR-profiling cannot detect everything at the same limit of detection like the conventional analyses, i.e. in some cases it is less sensitive, which may lead to a difference between results of conventional analyses and NMR-profiling.
- Optimization of models for detection of adulteration as well as botanical and geographical origin is an ongoing process. Information on each sample prior to analysis is very helpful, e.g. if we know the botanical origin of a sample, e.g. rape seed/canola, we can use a specific rape seed/canola model instead of a more general model for polyfloral honeys. As the rapeseed/canola model only compares to honeys of the same type, variability of data is less and deviations are detected more precisely.
- and will allows for narrower spread of data enabling us to make
Our promise
QSI is continuously working on extending the honey database in order to further improve the statistical analysis, to provide more options to detect adulterations and additional classification models for geographical and botanical origins at the highest achievable confidence level.